How we know our AI marking is accurate
Estimated reading time: 8 minutes
At CENTURY, we build AI that saves teachers time and helps students learn more effectively. One of the systems we’ve been working on marks exam-style GCSE maths questions. It is accurate and reliable, agreeing with expert markers on over 95% of individual marking decisions. In this post, we’re going to give that number some context, and talk about how we built and use an evaluation dataset (evals).
Why we needed evals
Our Maths Prep GENai offering assesses student answers against a mark scheme, the same well-defined breakdown of what earns each mark that teachers work from when they mark a GCSE paper by hand. The marking is done by LLMs inside our marking harness: the layer around the model that gives it the mark scheme, provides tools for the specific tasks marking involves, and applies deterministic rules that shouldn’t be left to the model’s judgement, such as enforcing mark dependencies.
Initially, it was an open question whether LLMs could even mark answers at this level. Once that was answered with a resounding yes, we needed a way to measure how well the system worked, and what impact changing it might have. That’s where evals, short for evaluations, come in. An eval is just a test with a known right answer: a set of student responses we’ve already marked ourselves, which we run the system against to see how closely it agrees.
The difficulty is that a marking system isn’t a set of independent parts. The instructions we give the model, the tools it can call and the rules the harness enforces all feed into the same judgement, so a change made to fix one thing can quietly alter how everything else is marked. This is known as a regression: a change that improves one case while breaking others that used to work. It is easy to make one, and without a way of checking it can be completely missed.
This is what evals are for. They let us measure the system before a change and after it, across the whole dataset rather than the one answer that prompted the change.
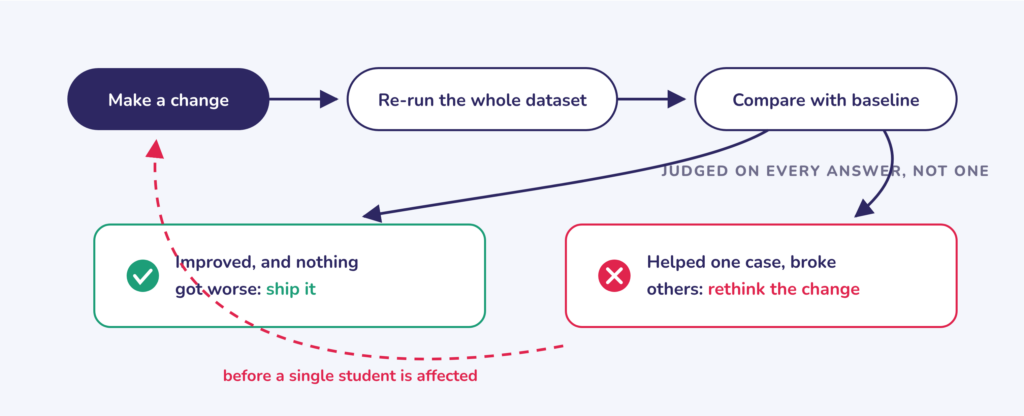
Here’s what that looks like in practice. Say we spot the system being too strict: a student gives a correct answer as a fraction, the mark scheme shows a decimal, and the mark is denied. We adjust the prompt to be more accepting of equivalent forms, try the answer again, and the mark is now awarded. Job done? Without evals, that is where the story ends. We would have no idea whether the same change also made the system more generous where it shouldn’t be, quietly awarding marks to answers on other questions that don’t deserve them.
With evals, the same change gets judged properly. We re-run the whole dataset and see the full picture: the fraction answer is now marked correctly, a handful of similar answers on other questions improved too, and nothing got worse. Or we see the opposite: the fix helped one case and broke five others, and we go back to the drawing board before a single student is affected.
Building the dataset
We worked with our Maths team to create an in-house dataset to help us build the Maths Prep marking system. The team created over 90 questions and mark schemes that were representative of actual GCSE questions. For each question, they wrote sample answers and recorded which marks each one should receive and why. The key point is that this wasn’t just the number of marks an answer should get. It was a true or false decision for every available mark.
This is one place where having maths experts, data scientists and engineers working side by side really matters: the dataset is only as good as the expert judgement inside it, and the system is only as good as the dataset.
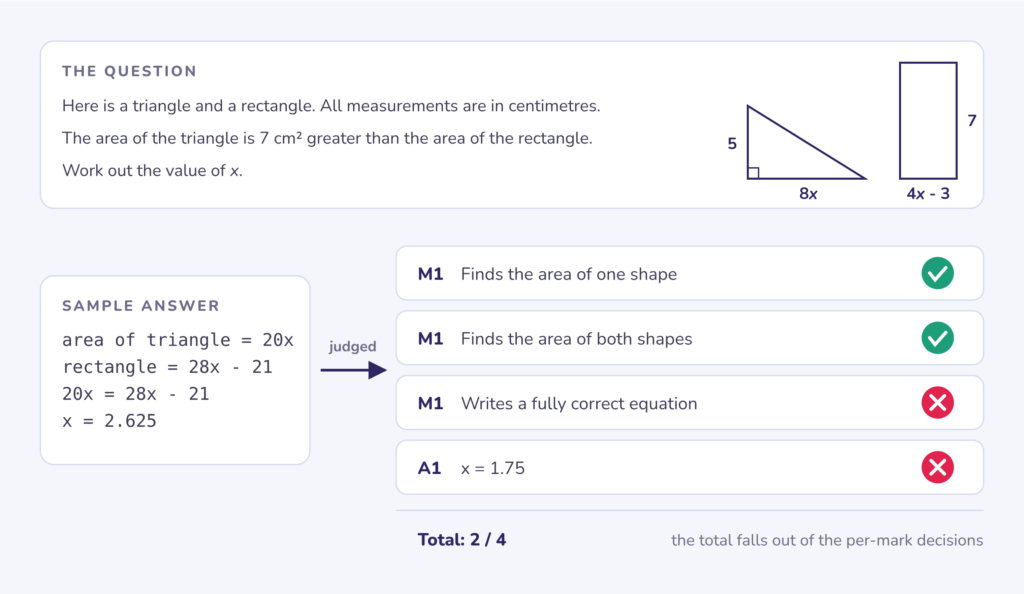
Here is one item from the dataset. The question shows a triangle and a rectangle, and says the area of the triangle is 7 cm2 greater than the area of the rectangle. Students work out the value of x. The scheme has four marks: one for finding the area of one shape, one for finding both, one for writing a fully correct equation, and one for the answer, 1.75. The sample answer below finds both areas correctly but then sets them equal to each other, forgetting the 7. Our Maths team gave it the first two method marks and withheld the other two.
To capture the weird and wonderful answers real users produce, we tested early versions of the feature internally with staff and added what we found to our sample answers. These example answers act as tests, and for tests to be useful, we need good coverage.
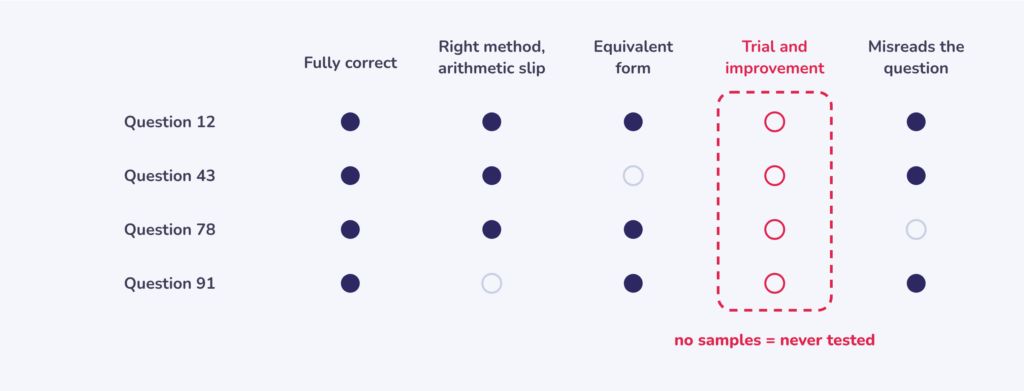
We ended up with just over 1,000 individually judged marks across all mark types.
Running the evals
The dataset lets us assess how well the system is working. We give each question, mark scheme and answer to our marking system, then record whether it gave the mark or not. That decision is compared with what the marker said it should be (the ground truth).
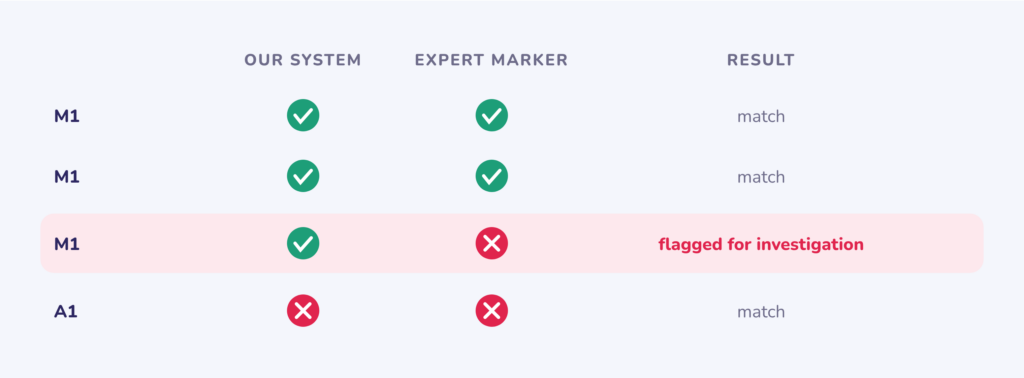
A single evaluation run puts every answer in the dataset back through the system, as if a thousand students had each just submitted an answer, and compares every marking decision with the expert’s. It outputs a report giving us a headline accuracy number (how many marking decisions were correct), but also breaks things down to give a better picture of what’s working well and what’s not, including over-marking vs under-marking stats, accuracy across mark types and accuracy by question. Understanding where the issues are, and whether there are high-level patterns, helps us prioritise what to fix.
We also have full agent observability via Logfire. This lets us see exactly what the agent did, what tools it used, read its internal reasoning and see the final decision. In other words, we can understand why a decision was made, not just whether it was right.
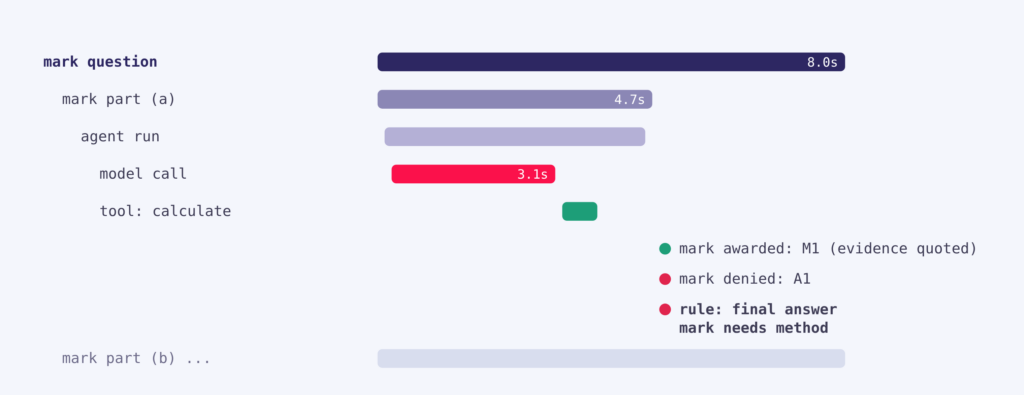
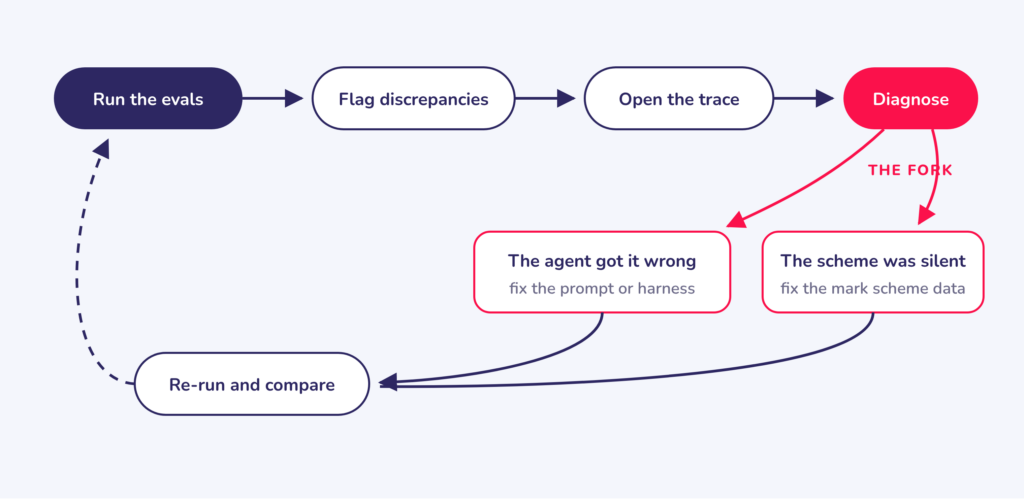
Once we implement a fix, we run the evaluation again to check the fix is working as intended, and that it hasn’t unintentionally degraded performance on other questions and answers.
Letting Claude do the legwork
After performing this loop many times, we realised we had a structured process that could be replicated. So we created a Claude skill and gave it access to the same data points we use ourselves. It works through all of the discrepancies and identifies where in the chain each issue sits. This helped us quickly uncover things like prompt blind spots, unclear mark schemes and model shortcomings, so we could focus our time on finding solutions.
Trying new models
Another benefit of a robust eval dataset is that we can see whether changes to the system make it objectively better or worse. When a compelling new model or model version is released, it is tempting to switch straight away, but it would be irresponsible to do so without understanding the impact.
What if we wanted a smaller, faster model, so students aren’t waiting as long for their answers to be marked? Does that affect accuracy? Our testing framework lets us answer these questions and make informed decisions.
What the number means
So how does the system actually perform? Across our evaluation dataset, it agrees with our expert markers on over 95% of individual marking decisions. In practice, that means the vast majority of answers get exactly the marks an expert would have given them, and when the system does disagree with the marker, it is almost always by a single mark on a single question. It’s also worth saying that the marks it gets wrong are often the contentious ones: borderline judgements where two experienced markers might not agree either.
More importantly, the evals mean we understand our own performance. We know where the remaining errors are, which questions and mark types they cluster on, and which way they cut. Over-marking (giving a mark that shouldn’t have been given) and under-marking (withholding a deserved mark) are different failures. Losing a deserved mark is frustrating, but being told a wrong method was right teaches the wrong thing. We track both, and watch how the balance shifts every time we change something.
At the start of this post, we said our system is accurate and reliable. There is a number behind that claim, but the number was never really the point. A single figure can be lucky, or cherry-picked, or measured on a dataset that flatters the system. What makes the claim trustworthy is everything behind it: a dataset built mark-by-mark with our Maths team, a report that tells us not just how often we’re wrong but in which direction, full traces of every decision the system makes, and a working loop that turns each discrepancy into a fix. And none of it runs itself. The loop only works because a multidisciplinary team keeps turning it: maths experts to say what the right mark is, and data scientists and engineers to make the system agree.
That’s the real capability. Not that the number is high, but that we can see exactly where we’re wrong, and we have a process that makes the number go up.
It also means we can keep moving. When a new model is released, or we add new question types, or a mark scheme needs a feature we haven’t handled before, we don’t have to guess whether the change helps. We run the evals and find out.
Ready to test our AI marking against your own judgement?
To see Maths Prep GENai from a learner’s side, read our launch post.
Existing Customers: Register your interest in the beta and check our AI marking accuracy against your own marking, or contact your Account Manager or email support@century.tech.
New Customers: Book a demo to see how CENTURY supports GCSE maths teaching and exam preparation.
About the author: Paramdeep Khangura is Head of Machine Learning at CENTURY, where he leads the work on the marking system behind Maths Prep GENai. His earlier work includes CENTURY’s AI writing assessment, which won the MIT Solve AI-Enabled Assessments Challenge.
CENTURY in the news
View all News
-

News
21st October 2026
International study finds students using CENTURY up to 58% more likely…
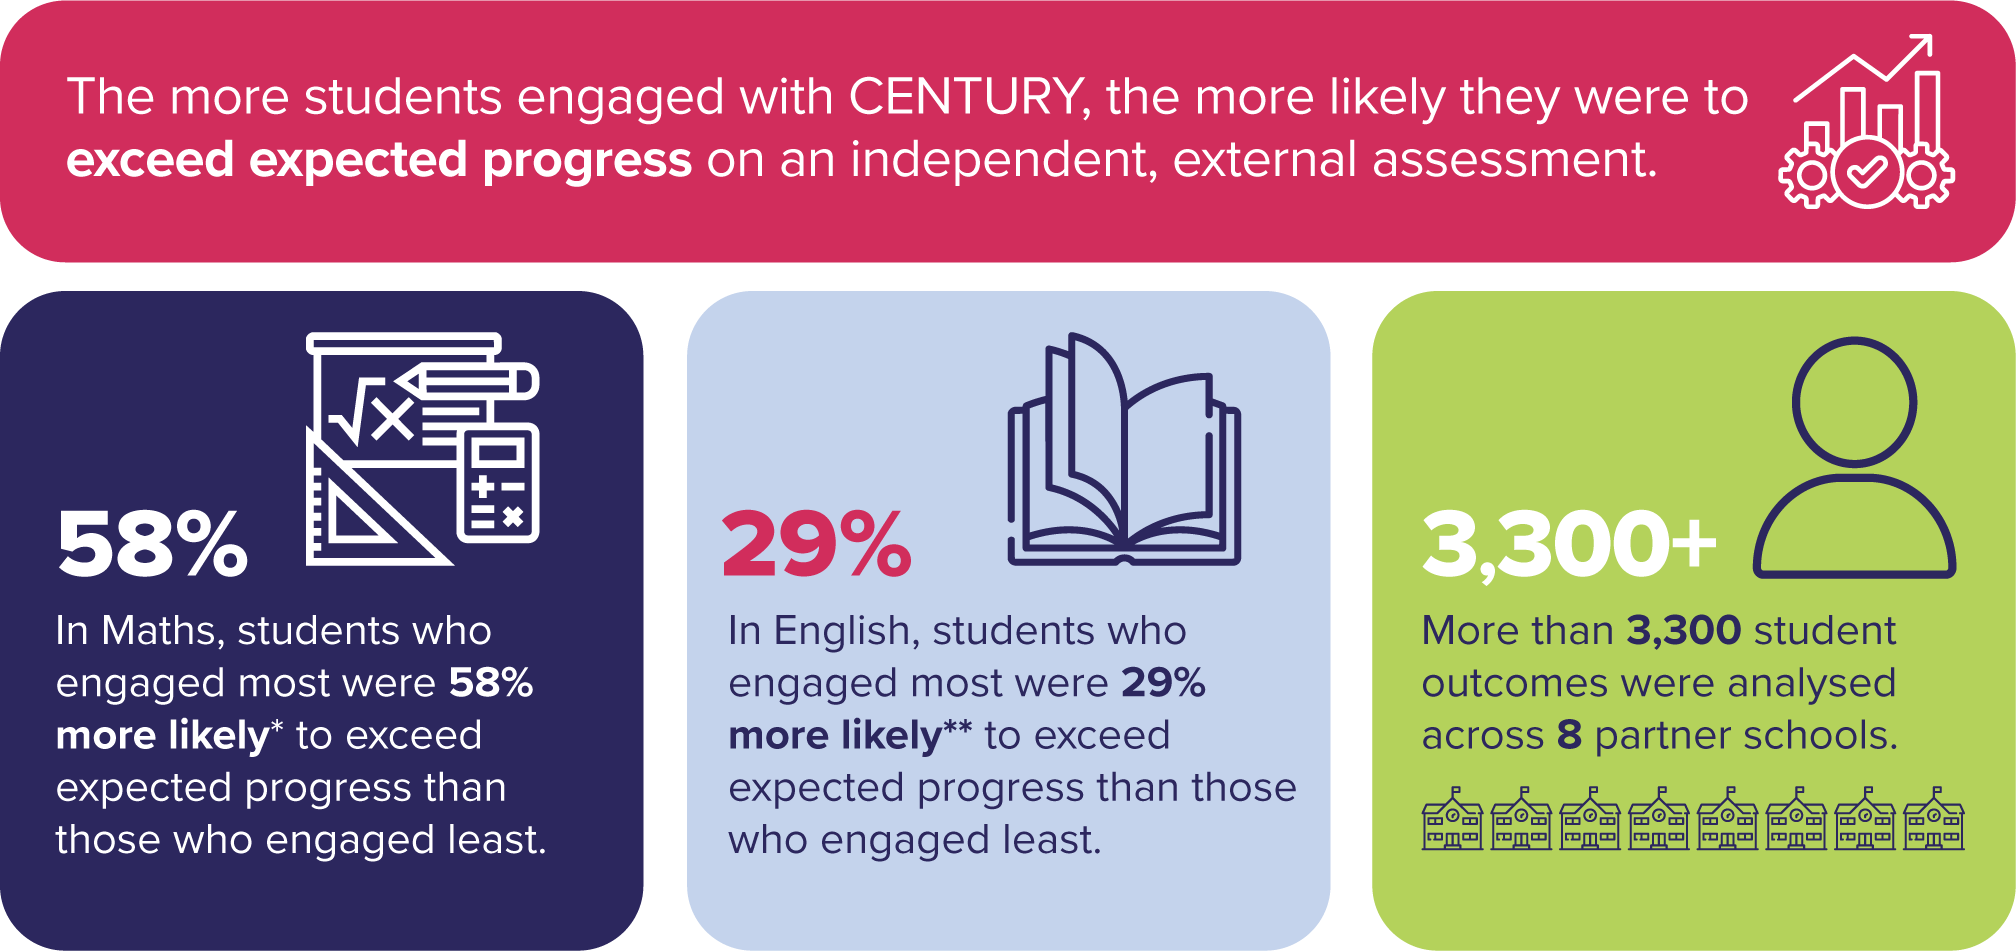
A new study of more than 3,300 progress outcomes across eight Inspired Education Group schools found students who engaged most with CENTURY were up to 58% more likely to exceed expected progress in maths and 29% more likely in English.
Read more
-

Case studies
19th October 2026
How Myanmar Vision International School delivers personalised learning for IGCSE
Myanmar Vision International School in Yangon made CENTURY the main way it teaches IGCSE maths and science. IGCSE Coordinator Andrew Rogers explains how personalised learning, backed by one-to-one support from learning guides, works for a small cohort.
Read more