Measuring progress using CENTURY’s diagnostics
Estimated reading time: 3 minutes
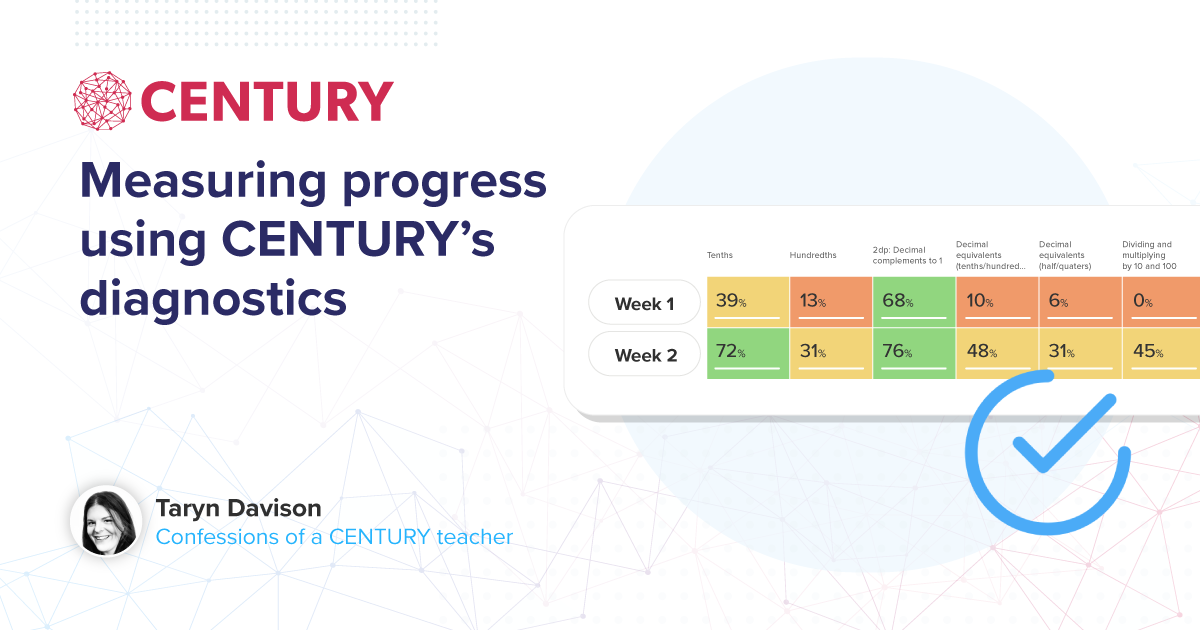
CENTURY is an AI-powered online learning platform that personalises learning and provides teachers with actionable insights to support their teaching. Taryn Davison, a former primary teacher now on our Customer Success team, leads training on how best to use the platform. Wanting to see how to better incorporate our data insights, she taught a CENTURY maths lesson weekly for half a term to a Year 4 class at St. John’s C of E Primary School, Abram. Part of Quest Academy Trust, St. John’s has been using CENTURY for the past six years. This blog series shares her findings.
Progress in student learning is a complex aspect of teaching, and identifying the factors contributing to that progress is even more challenging. A straightforward method to gauge progress is through pre- and post-assessments, which I implemented in my teaching of a unit on decimals by administering the Fractions and Decimals diagnostic at both the beginning and end of the unit.
Whole Diagnostic Results
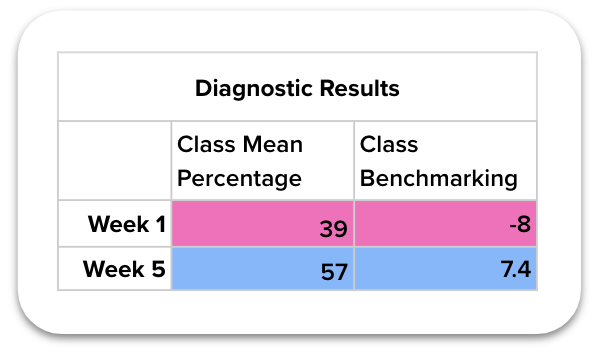
The Class Mean Percentage is a key metric available on CENTURY, found in the Nuggets tab as the “Average Last Score.” To understand the significance of this score, CENTURY’s benchmarking data offers a comparison against a wider dataset of students.
The results were encouraging: there was an 18% increase in raw scores between the pre- and post-assessments. While this increase is positive, the benchmarking scores provide deeper insight. Initially, the class scored -8% below the average student performance on the diagnostic for their year group. After the unit, they scored 7.4% above the average, indicating substantial progress relative to their peers.
Question level diagnostic results

To dive deeper, I analysed the specific questions of the decimal section of the diagnostic. I compared the percentage of students who answered each question correctly in the pre- and post- assessments by downloading the data from the Nuggets Tab. The chart I created shows clear progress across every national curriculum objective.
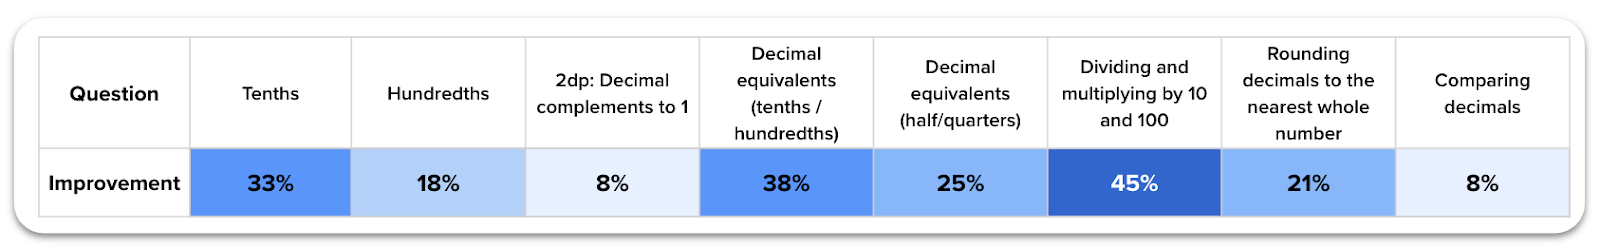
Caption: This chart shows the mean percentage improvement for each question in the decimals diagnostic. These values are in absolute terms.
Throughout the unit, students engaged with nuggets covering all the objectives, and I devoted time to teaching each one, with the exception of decimal complements and comparing decimals. Remarkably, after just five lessons on CENTURY, the students showed an average improvement in absolute values of 25% across all the objectives, and 32% in the objectives I taught. Although typically more time would be spent on this unit, these results highlight the significant impact of targeted, efficient teaching within a short timeframe.
Takeaways for using diagnostic data:
- Download pre-assessment data: Before starting a unit, download the diagnostic data to find the average score for each area. This information is crucial for tailoring your lesson plans to address areas of weakness. Retain this data for comparison after the unit.
- Request benchmarking data: To better understand how your students are performing relative to others, obtain benchmarking data through your Account Manager. This allows you to contextualise your students’ progress within a broader spectrum, giving you a clearer picture of their achievement.
- Compare pre- and post- averages: After completing the unit, compare the average scores for each objective. This comparison helps identify which objectives have been successfully understood and which may require additional focus or review later on.
By systematically using diagnostic and benchmarking data, you can not only measure progress more accurately, but also make informed decisions on how to adapt your teaching strategies to meet your students’ needs more effectively.
Tune in next week to hear how Taryn analysed the diagnostic results of different ability groups. Click here to book a demo of CENTURY.
CENTURY in the news
View all News
-

Case studies
21st July 2026
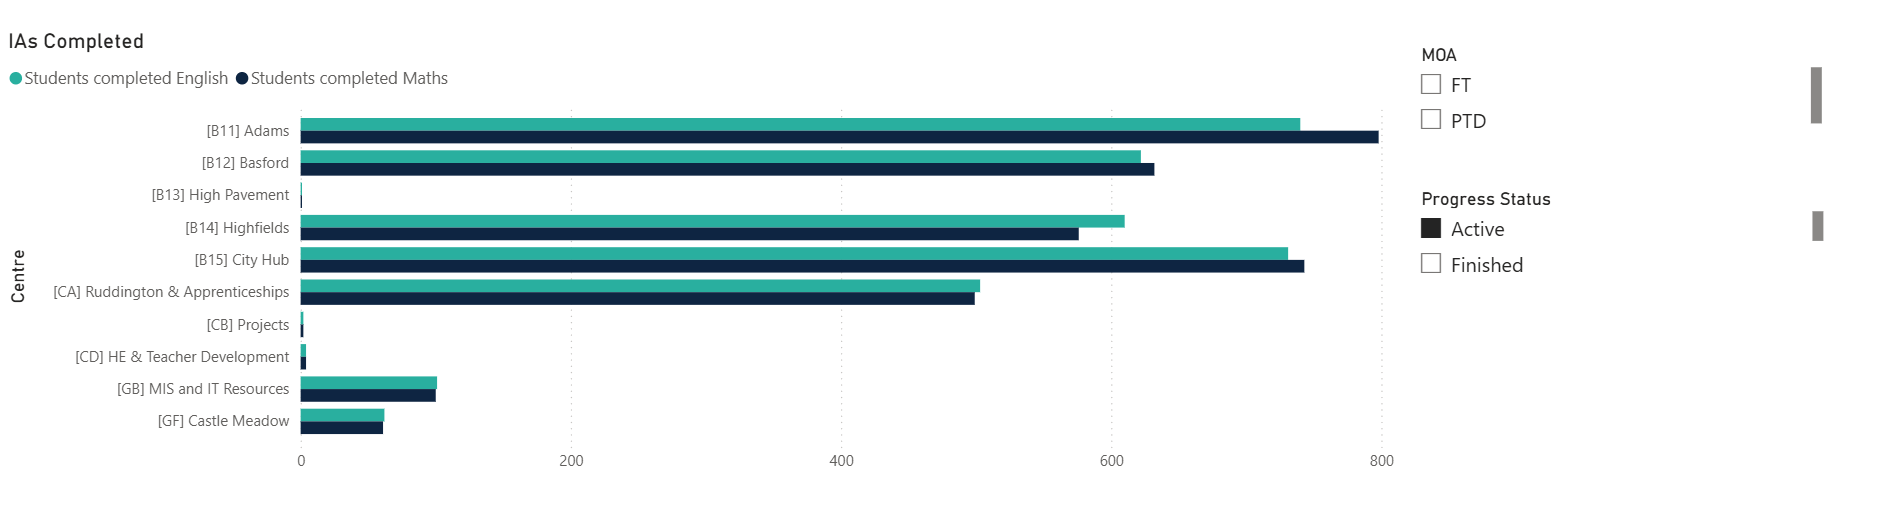
How Nottingham College Transformed Initial Assessments and Student Tracking with CENTURY
How Nottingham College uses CENTURY to track initial assessment compliance and build accessible, personalised learning pathways for over 20,000 students.
Read more
-

Blog
8th July 2026
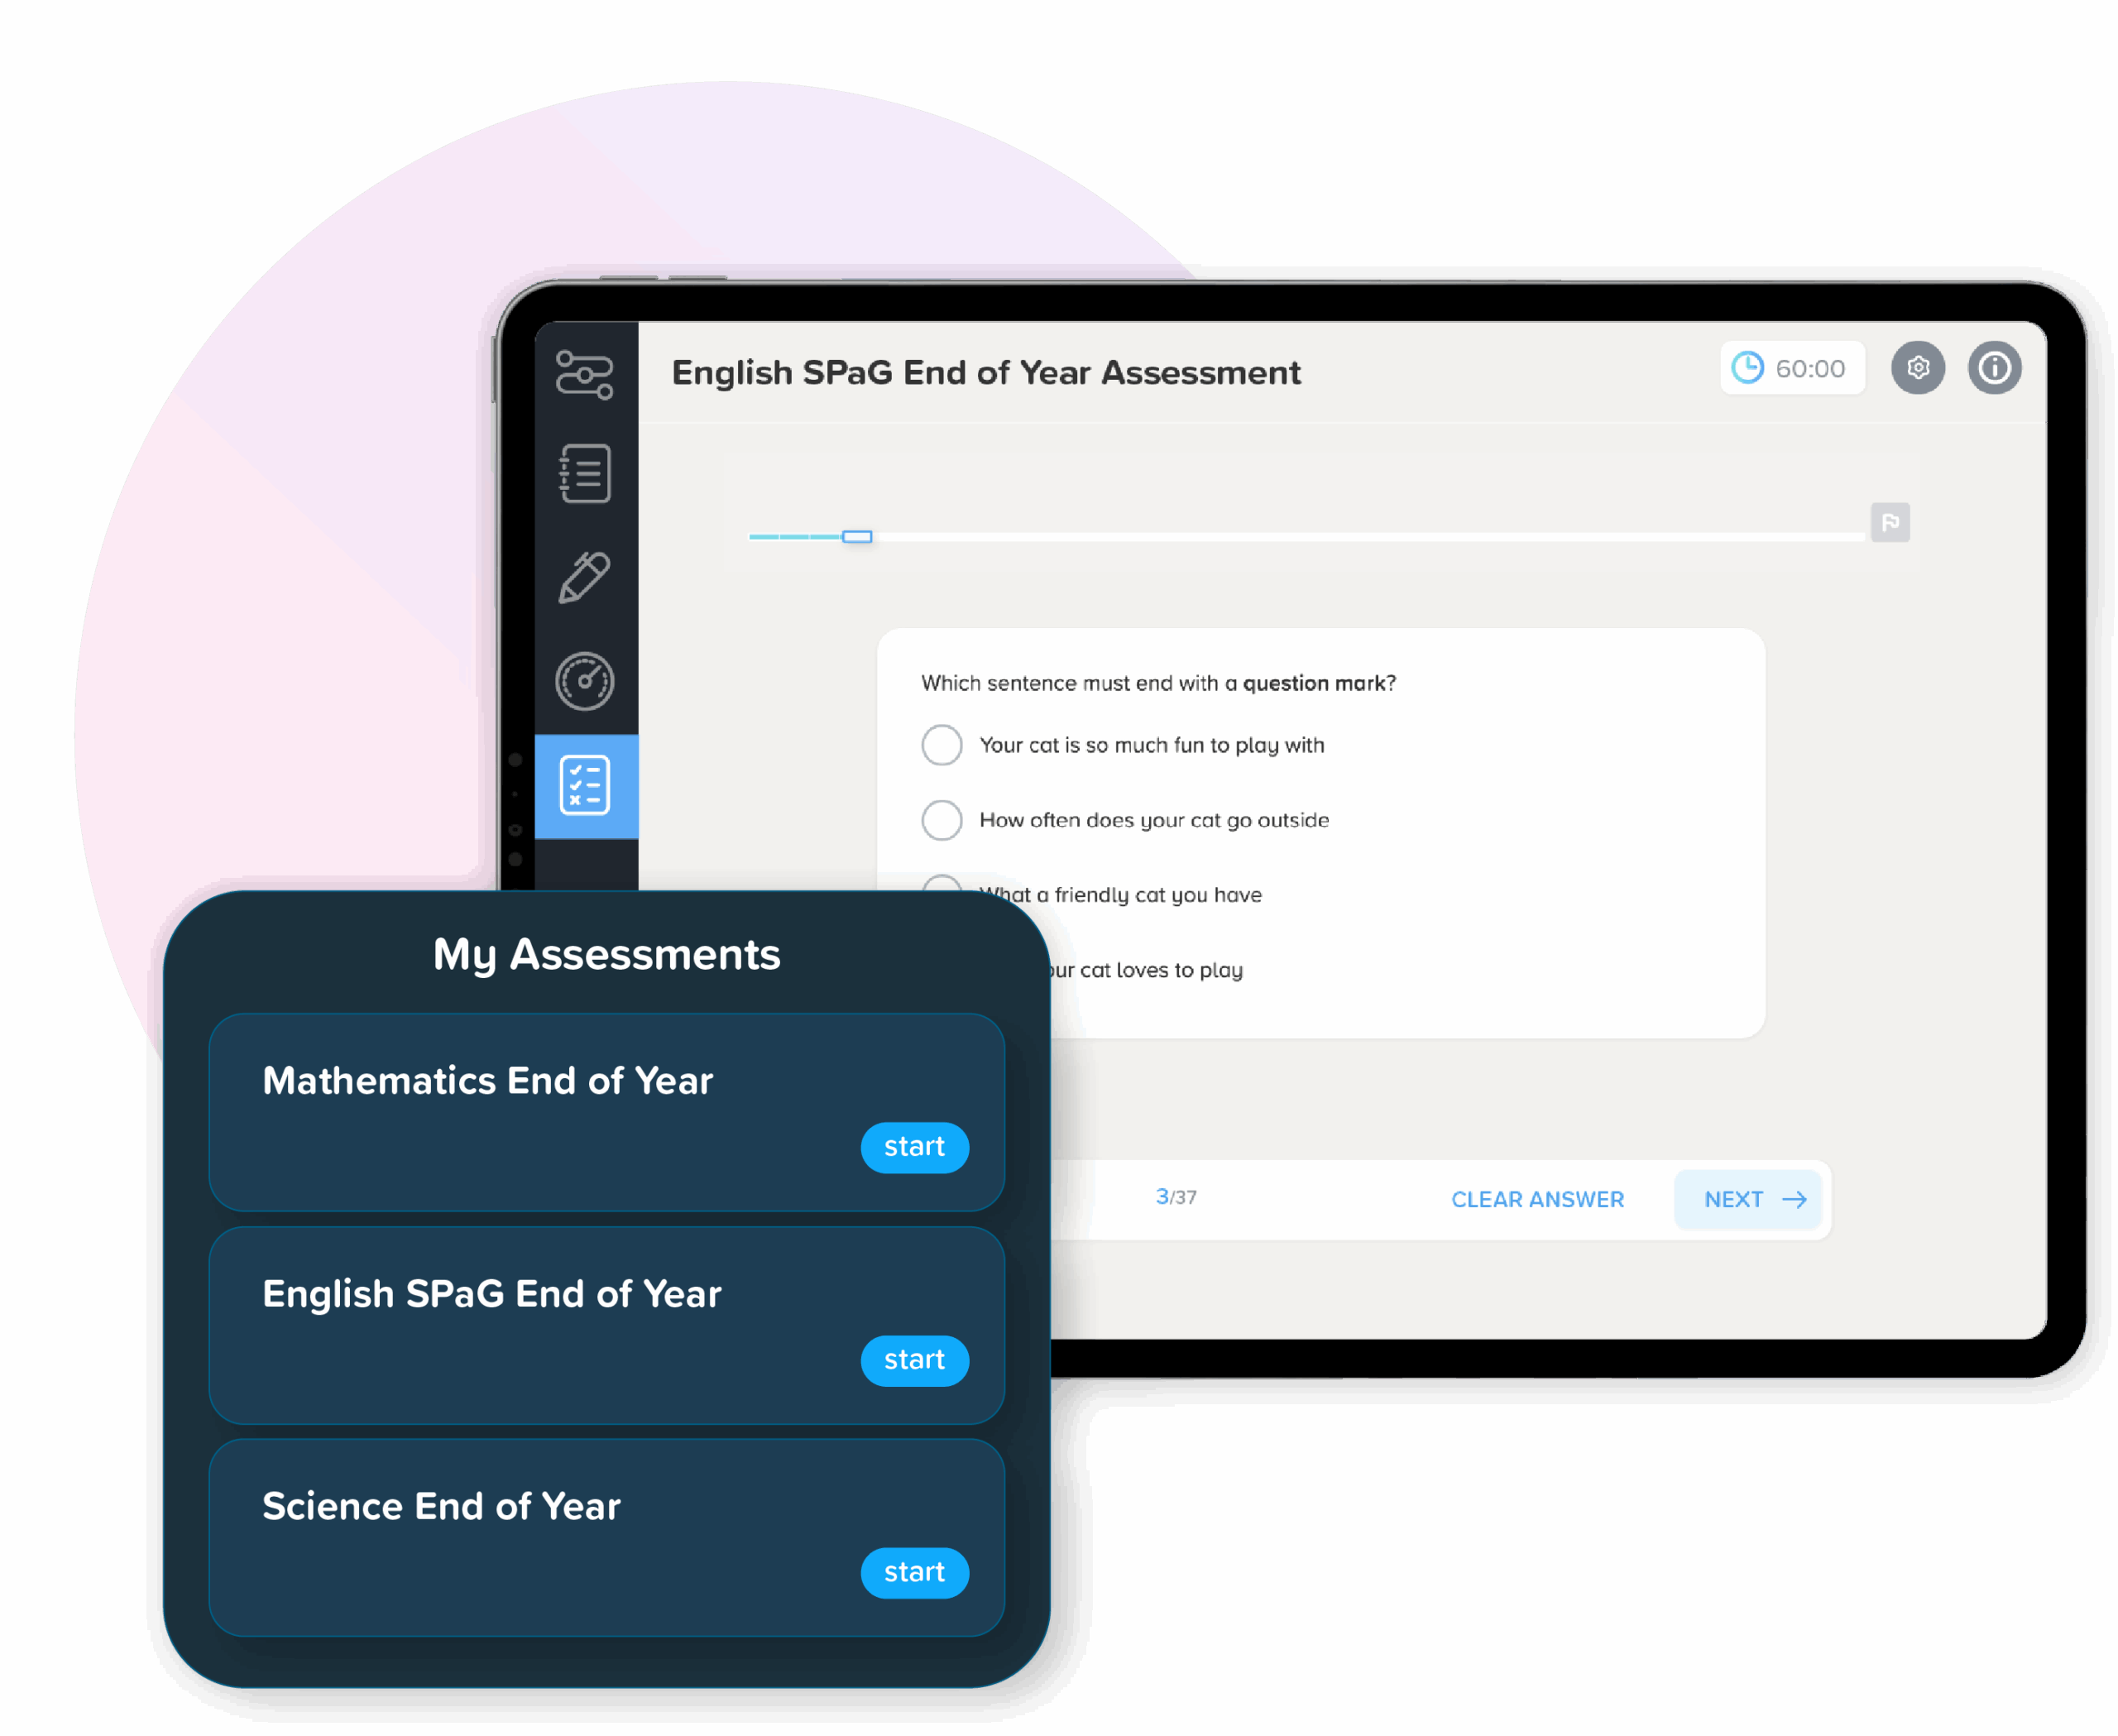
How we write a CENTURY assessment question
Every CENTURY assessment question goes through the same process: mapped to the curriculum, written to a style guide, checked for fairness, then reviewed and trialled with real pupils before it ever reaches a test. Here's how it's done, and why…
Read more