Scheme of work planning with CENTURY data
Estimated reading time: 4 minutes

CENTURY is an online learning platform that uses AI to personalise learning and provide teachers with actionable insights to support their teaching. Taryn Davison has over ten years’ experience as a primary teacher and Maths Lead. Now working in our Customer Success team training our schools and colleges, she wanted to put our CENTURY training to the test as well as use our new benchmarking data reports in a real-life setting. She taught a CENTURY maths lesson weekly for half a term to a Year 4 class at St. John’s C of E Primary School, Abram. Part of Quest Academy Trust, St. John’s has been using CENTURY for the past six years. This blog series shares her findings.
Having the year 4 class complete the topic diagnostic in lesson one, I was free to analyse the data in detail in order to best inform my planning. I would argue that you should do this at the start of every unit of work, especially as you don’t need to mark it!
Identifying curriculum objectives:
Alongside some teacher assessment, I looked at diagnostic data to see how to spend my time over the course of the next 5 weeks based on questions they got wrong in decimals. CENTURY told me the curriculum objectives I needed to focus on. Teacher assessment helped me determine the pitch of my lessons.

Identifying revision areas:
Looking at the previous unit of work on Fractions, I identified the areas in the diagnostic where a specific group of students had struggled. I made sure to include an opportunity for them to work with an adult in the series of lessons to target the areas they did not understand from the previous unit of work, before the concept had been forgotten.

Stretch and challenge:
I identified those students in the diagnostic who had got the planned lesson objectives correct and I made sure that I provided them with personalised activities to push them in the relevant lessons.

Support:
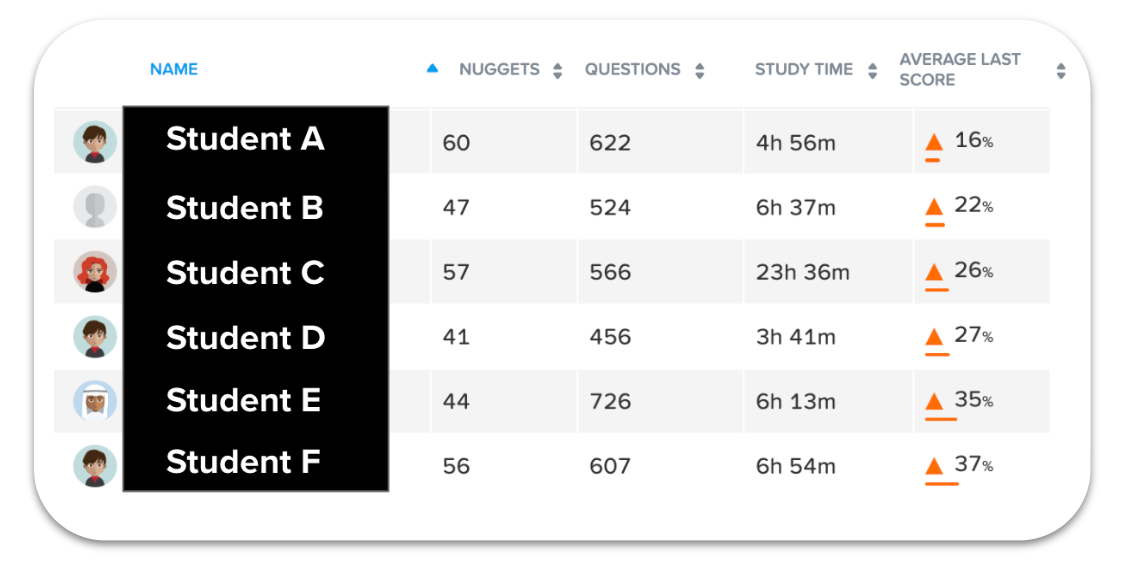
I reviewed the students’ average scores in the Year 4 mathematics course, focusing on those who performed poorly on the diagnostic. After further in-class assessment, it was clear that none of these students were meeting age-related expectations for Year 4—or even Year 3—and typically needed adult support in class. With this insight, I ensured they had access to relevant physical and visual representations of concepts, manipulatives, and appropriately scaffolded work during full-class activities, allowing them to better engage with the learning material.

‘Quick Wins’ in class:
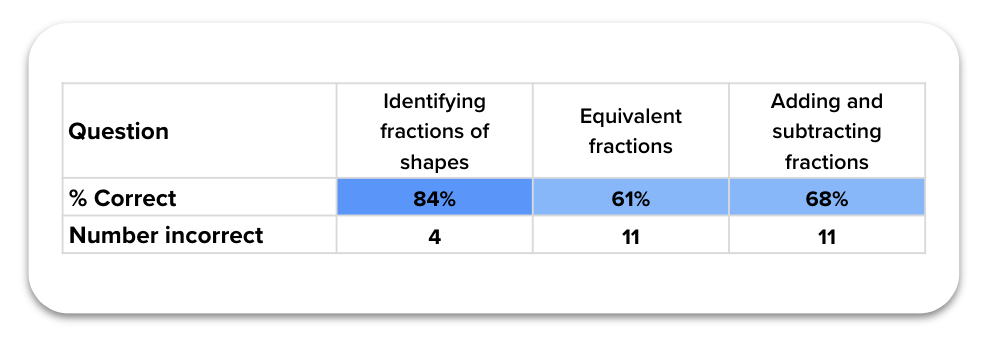
Using the question breakdown, it is possible to see where students have struggled within a concept and then quickly address it. I did this in a variety of ways: one to one support with an adult, group work with an adult, or whole class explanation of a specific misconception. Each of these interventions were targeted by CENTURY data.

Takeaways for using data:
- High-performing students: Able to know where students are going to need to be stretched in advance of your lesson.
- Students working below Age-Related Expectations (AREs): Able to put together a series of packs of manipulatives to help build children’s confidence in different areas. Diagnostic data will inform which students to target with these.
- Addressing misconceptions: Keep an eye on the nugget results when using CENTURY in class. This will tell you where to target your support in the most effective manner.
Tune in next week to hear how Taryn used CENTURY learning material to inform her lesson plans. Click here to book a demo of CENTURY.
CENTURY in the news
View all News
-

Blog
15th July 2025
Key Insights from the FE Focus Conference: Lessons for Shaping the…
In this blog, we share key insights from the FE Focus Conference, organised by CENTURY Tech in collaboration with Nottingham College, featuring a range of speakers from across the Further Education (FE) sector, sharing best practices on effective teaching and…
Read more
-

Blog
10th July 2025
The Science Behind CENTURY
In this blog post, Tom Thacker, Chief Education Officer at CENTURY, refers to Prof. Dr. Carl Hendrick's recently published guide into the science behind learning. Tom summarises the science behind learning and explains how and where this has been applied…
Read more