Measuring progress using CENTURY benchmarking data
Estimated reading time: 3 minutes
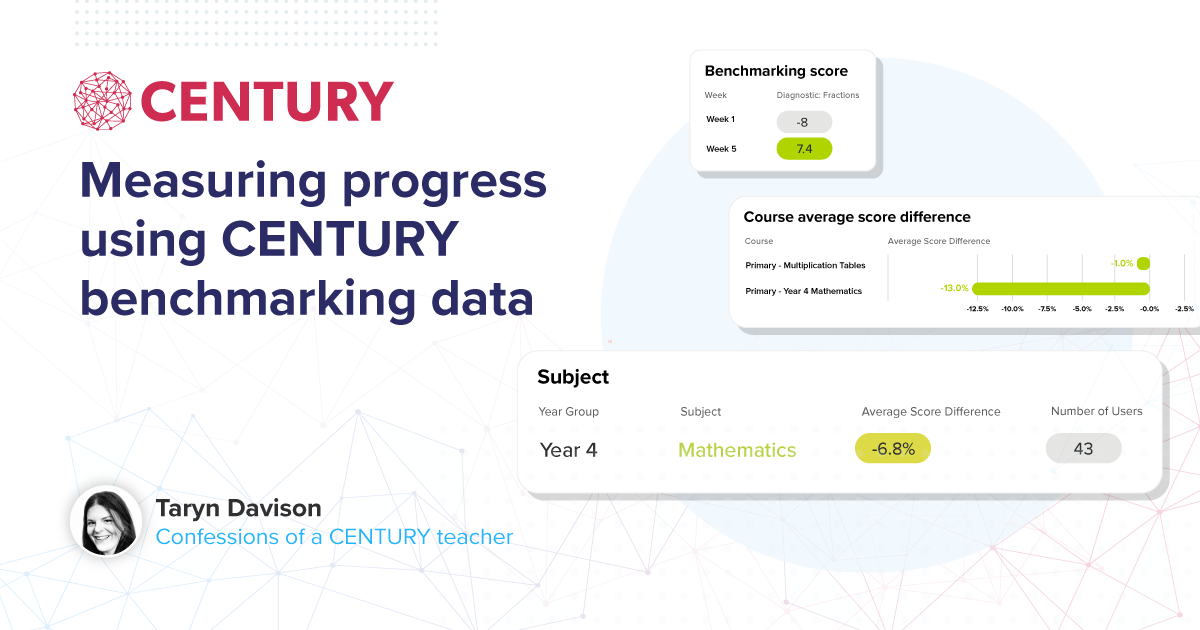
CENTURY is an AI-powered online learning platform that personalises learning and provides teachers with actionable insights to support their teaching. Taryn Davison, a former primary teacher now on our Customer Success team, leads training on how best to use the platform. Wanting to see how to better incorporate our data insights, she taught a CENTURY maths lesson weekly for half a term to a Year 4 class at St. John’s C of E Primary School, Abram. Part of Quest Academy Trust, St. John’s has been using CENTURY for the past six years. This blog series shares her findings.
As mentioned in a previous post, one challenge when teaching a new unit of work is not knowing students’ prior knowledge and even if I had taught them the concept previously, their memory of it would have deteriorated. Both of these scenarios make it difficult to pitch lessons correctly. When I was teaching I often received minimal handover when starting with a new class, which sometimes hindered both teaching and learning. In this case you end up asking, ‘Where is my starting point?’, ‘How do you pitch my lesson?’ This was amplified in my St John’s Abram venture as I didn’t have time for any handover with the class teacher.
To address this, I used CENTURY’s benchmarking data, which compares student performance across similar schools, to guide my teaching. This data helped me both to pitch my lessons accordingly and to track progress in the Decimals topic they’d studied previously as well as overall in the mathematics courses, allowing me to see how the class compared to the average school.
Year Group and Course Benchmarking
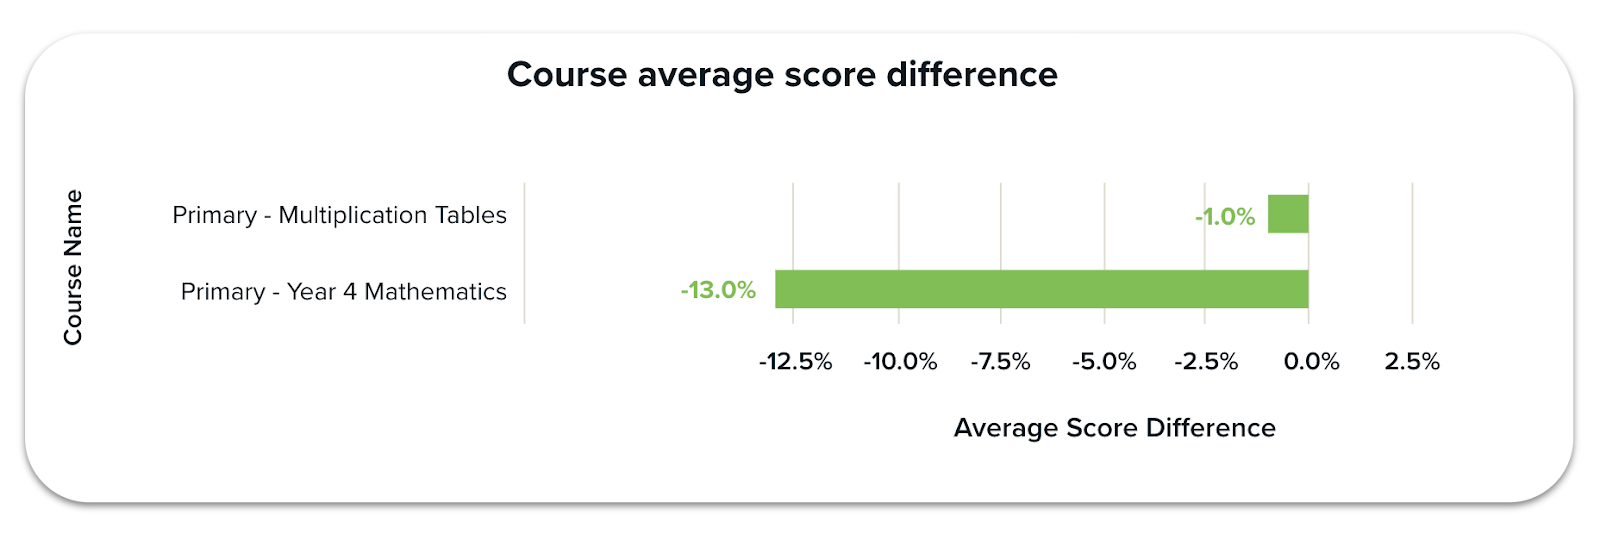
In Mathematics on CENTURY, the Year 4 students were working 6.8% below average. This overall lower performance raised a question: was the entire class underperforming, or just a small group of students?

By examining the Year 4 Mathematics course specifically, I found they were actually 13% below the average for UK state schools, as their higher scores in Multiplication Tables had been bringing the overall maths average up. This clarified that it wasn’t just a small group underperforming, but I needed to further analyse the data to tailor my lessons effectively.
Diagnostic benchmarking
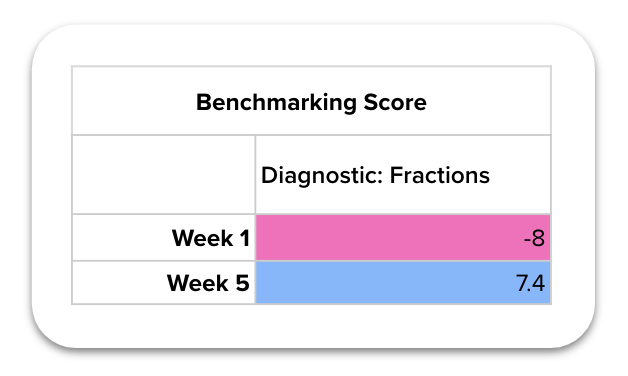
Benchmarking data was crucial for tracking progress during my unit of teaching. It allowed for detailed analysis, showing how students improved on specific nuggets and what those scores represented. For example, diagnostic assessments taken mid-unit and at the end of a Fractions and Decimals unit highlighted the class’s progress. Although an initial assessment taken right at the beginning of a unit of work would have been ideal, the available data still provided valuable insights.
Course and Topic benchmarking
By using benchmarking data, I tracked weekly improvements across the entire Year 4 Mathematics course (blue) and specifically in the Fractions and Decimals topic (red) of the Year 4 course. The class’s attainment during my unit of teaching in Year 4 Mathematics improved from 13% below the CENTURY benchmark to 7.3% below, showing steady progress. The Fractions and Decimals topic saw a significant increase, I imagine partly due to targeted teaching and also to guiding students on how to use CENTURY more effectively. The slight dip in the final lesson likely resulted from students taking a challenging diagnostic designed to assess end-of-year objectives and push those working at greater depth.
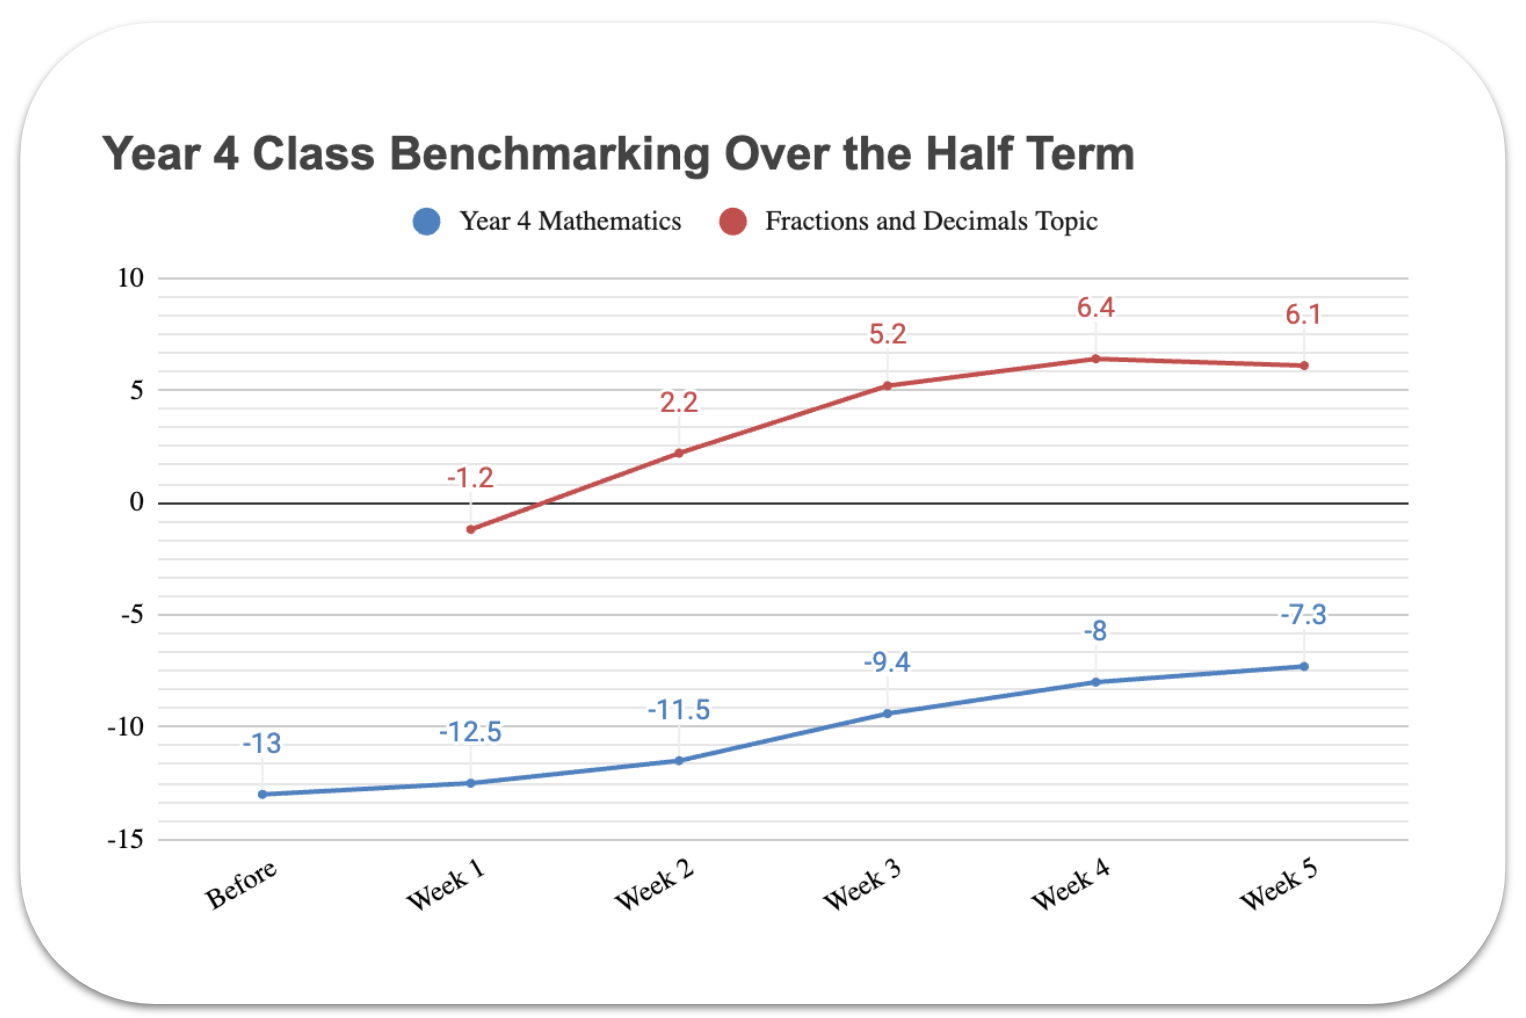
This graph was created by tracking the weekly benchmarking scores for the topic ‘Fractions and Decimals’ and the ‘Year 4 Mathematics’ course over the course of the half term.
Takeaways for using CENTURY’s benchmarking data:
- Dig deep into data: In smaller schools, analyse data at the class level rather than the year group level for more accurate insights.
- Track weekly progress: Monitor progress weekly instead of just comparing the beginning and end of a unit. A decrease in scores can highlight areas where the class struggles with specific objectives.
- Focus on course level: Don’t just look at subject-level data; course-level insights are crucial. For example, Multiplication Tables skewed this class’s data, so I excluded it to focus on areas needing more attention.
If you’re a subscribing school/college and would like to learn more about CENTURY’s benchmarking data, email your account manager or support@century.tech. Tune in next week to hear how Taryn measured progress using CENTURY’s diagnostic data. Click here to book a demo of CENTURY.
CENTURY in the news
View all News
-

Case studies
21st July 2026
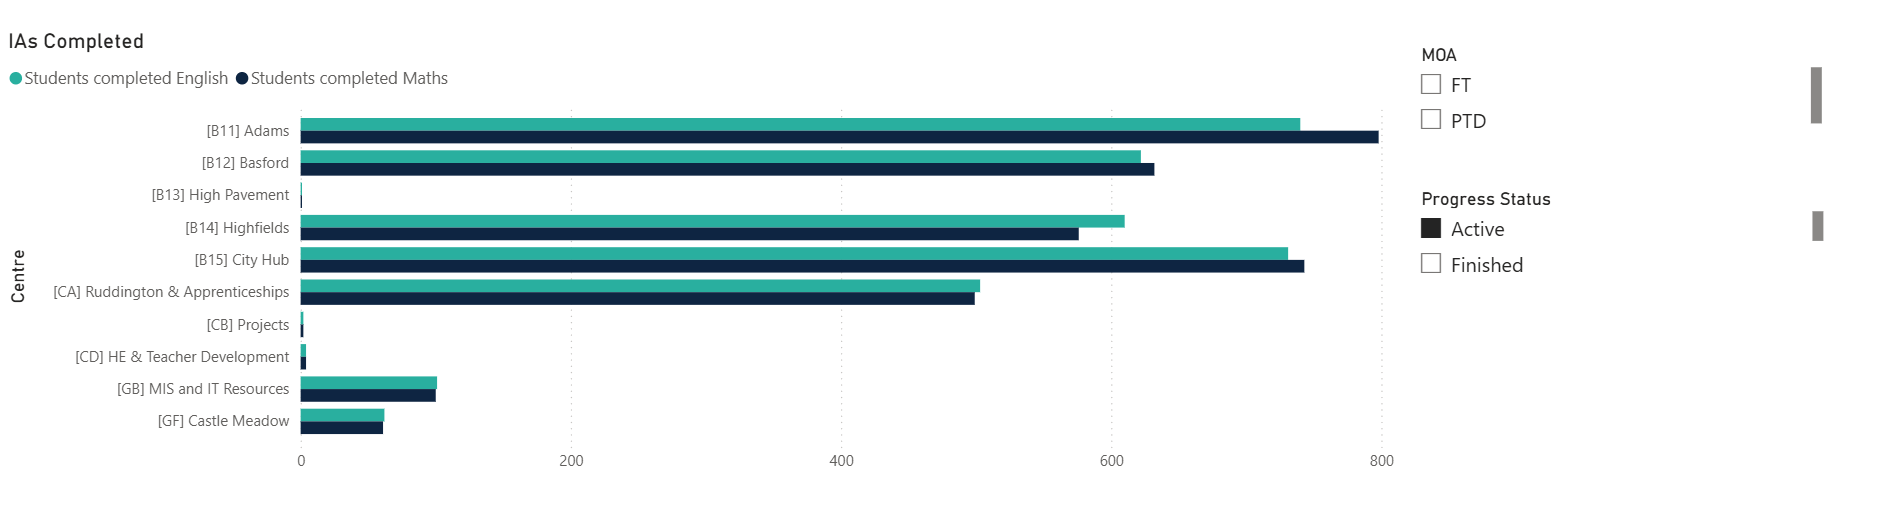
How Nottingham College Transformed Initial Assessments and Student Tracking with CENTURY
How Nottingham College uses CENTURY to track initial assessment compliance and build accessible, personalised learning pathways for over 20,000 students.
Read more
-

Blog
8th July 2026
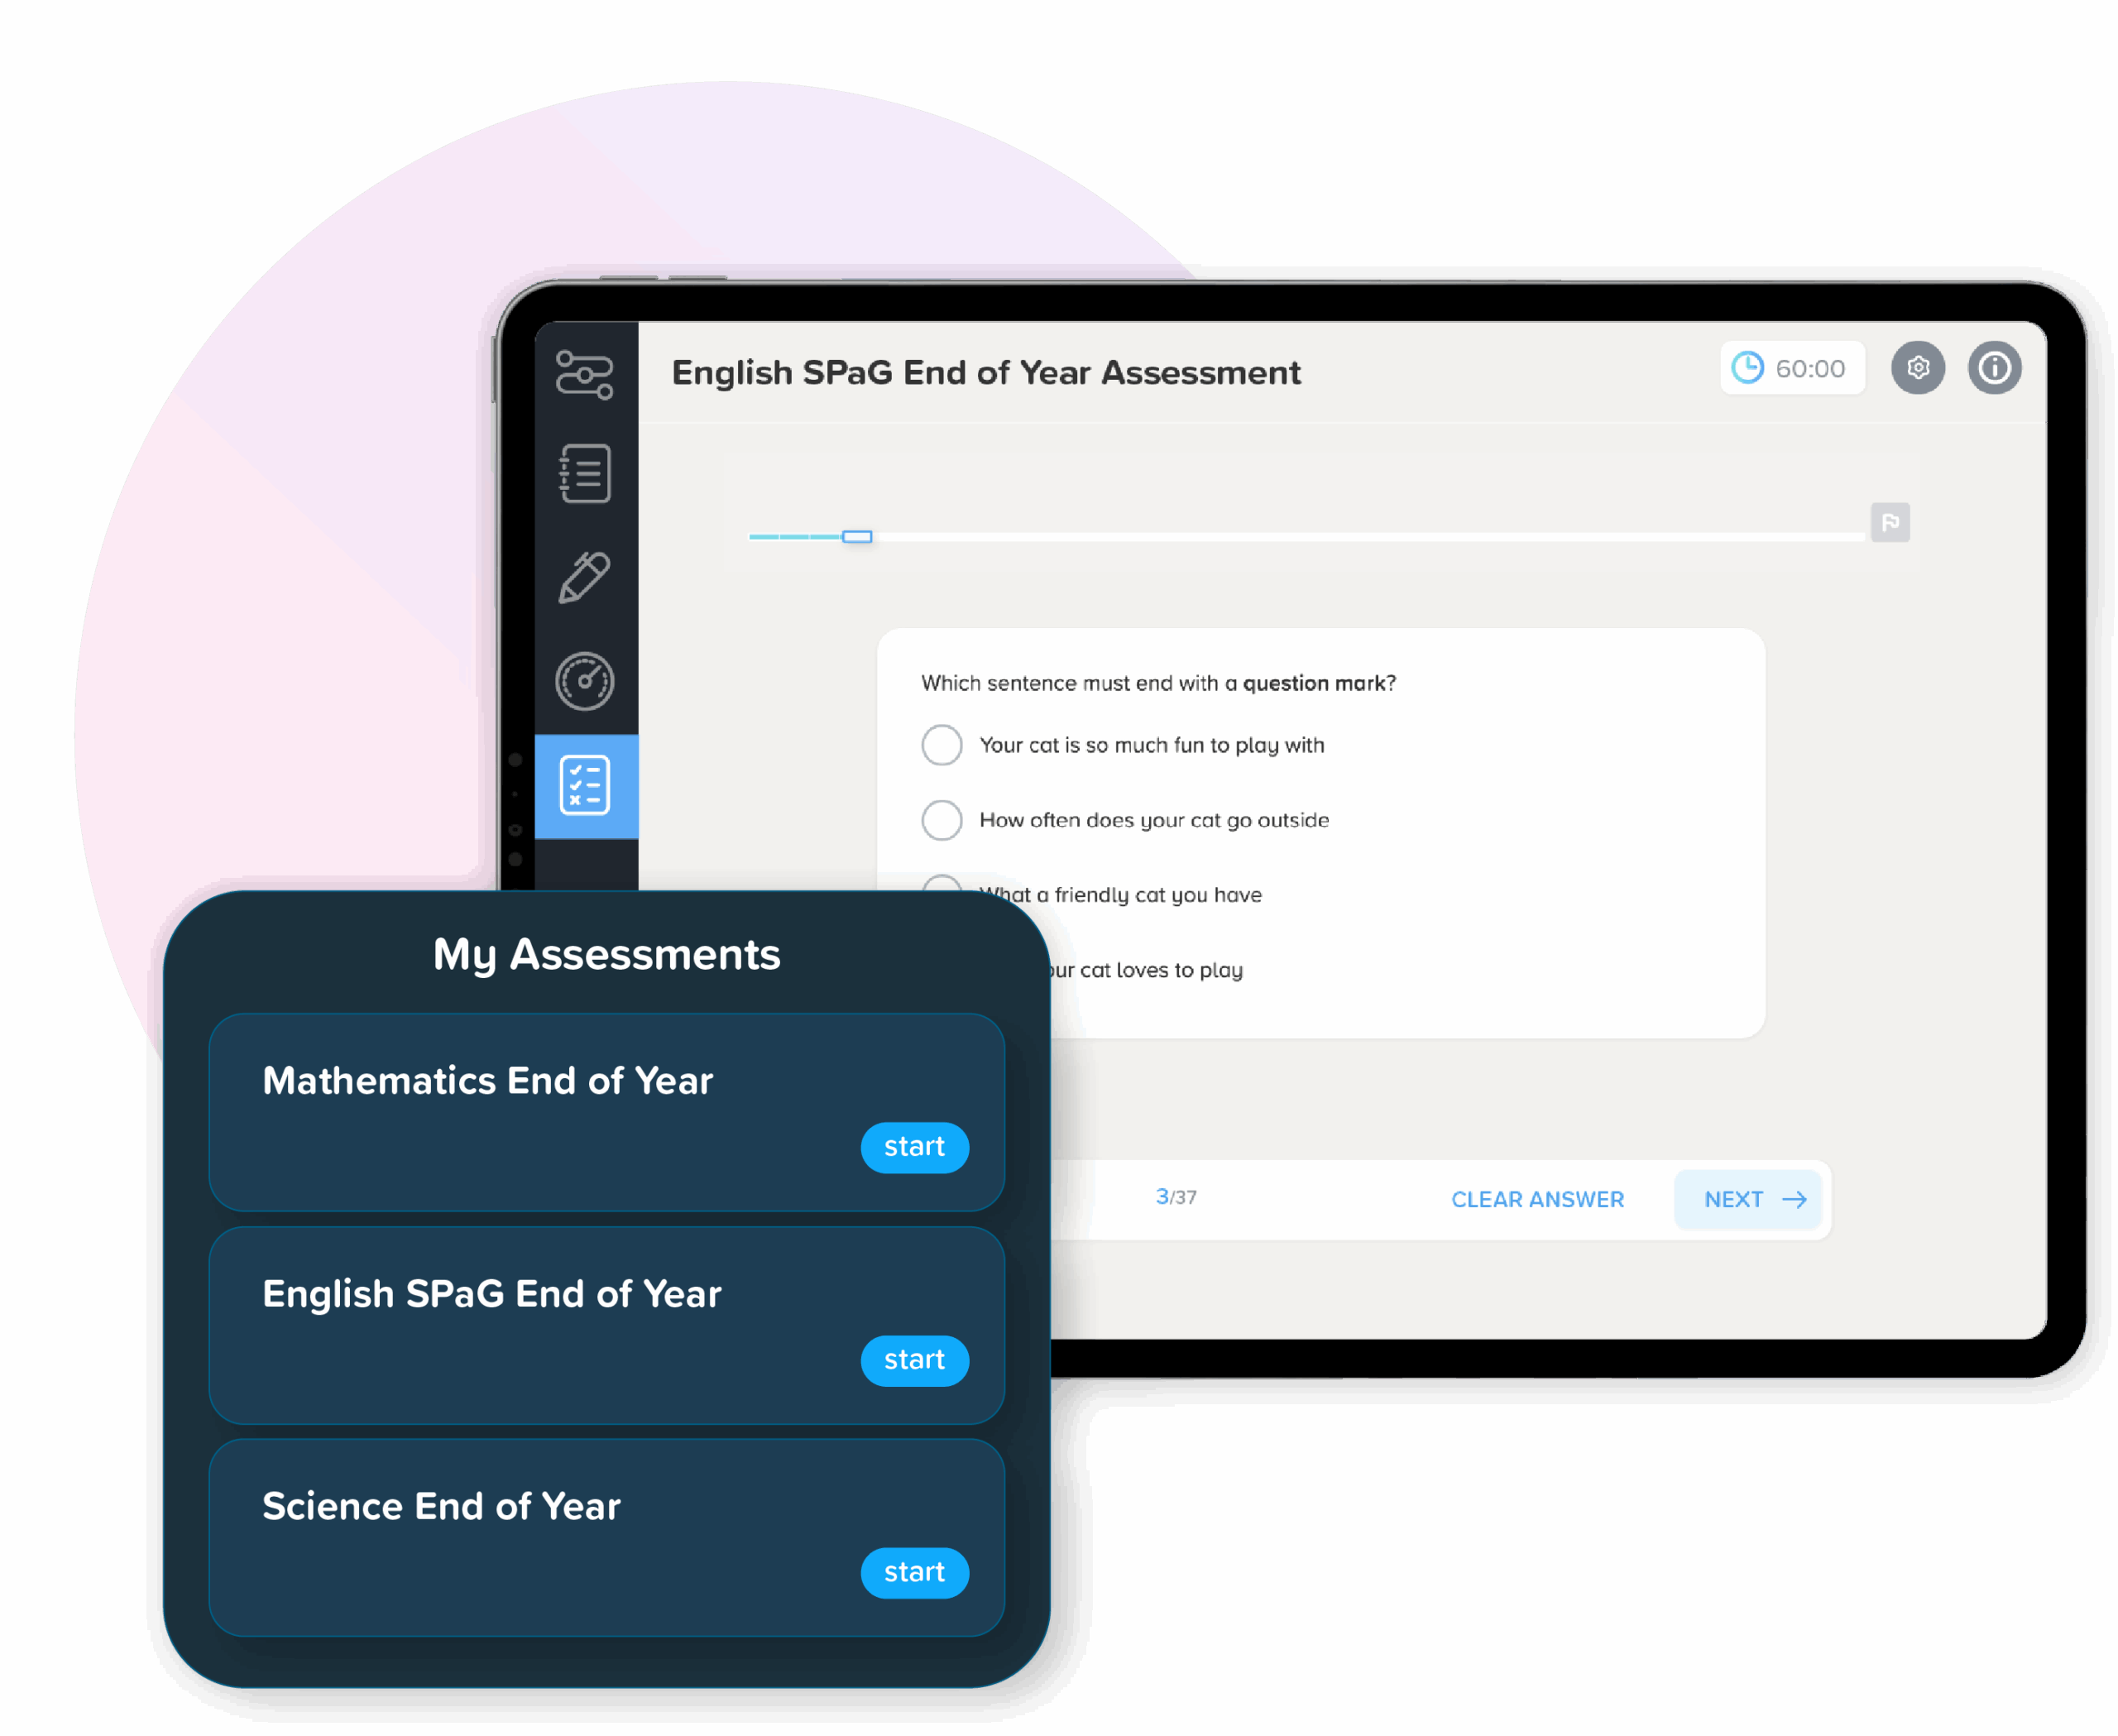
How we write a CENTURY assessment question
Every CENTURY assessment question goes through the same process: mapped to the curriculum, written to a style guide, checked for fairness, then reviewed and trialled with real pupils before it ever reaches a test. Here's how it's done, and why…
Read more